Data is the cornerstone of strategic decision-making. Companies that prioritize data are far better equipped to navigate challenges, identify opportunities, and achieve sustained growth.
With 2025 around the corner, now is the perfect time for business leaders, data analysts, and entrepreneurs to embrace data-driven goals in 2025. It’s vital to set effective data-driven goals, use actionable steps, and implement the right tools and platforms to support your journey toward success and bring these strategies to life.
Why Data-Driven Goals Are Critical for Modern Businesses
Data is more than numbers; it’s a window into your business’s performance and potential.
Without leveraging data, you are overlooking opportunities and insights that could be holding your business back:
· Increased Operational Inefficiencies: Without data insights, resources may be poorly allocated, leading to wasted time and effort.
· Missed Market Opportunities: Businesses may fail to recognize emerging trends or shifts in customer preferences, putting them at a disadvantage compared to data-savvy competitors.
· Higher Risk Exposure: A lack of data-driven risk assessment can leave businesses vulnerable to unforeseen challenges, such as market downturns or supply chain disruptions.
· Limited Customer Insights: Without analyzing customer data, companies risk delivering generic, untargeted experiences that fail to engage or retain their audience.
· Difficulty Measuring Success: It becomes harder to track progress or evaluate the effectiveness of strategies, leaving businesses without a clear understanding of their performance.
· Reduced Agility: Without real-time data insights, businesses struggle to pivot quickly in response to changing circumstances or competitive pressures.
Adopting robust business data strategies enables you to:
· Identify Trends: Understand shifts in customer behavior, market dynamics, and industry innovations.
· Enhance Efficiency: Pinpoint operational inefficiencies and improve resource allocation.
· Drive Innovation: Use insights to create new products, services, or experiences tailored to your audience.
· Boost Profitability: Discover hidden revenue streams and eliminate wasteful practices that erode margins.
· Improve Risk Management: Use predictive analytics to identify potential risks and implement proactive measures to mitigate them.
· Strengthen Competitive Advantage: Leverage unique data insights to outpace competitors by anticipating market needs and responding swiftly.
· Enhance Customer Experience: Personalize interactions and offerings by understanding customer preferences and behaviors through data.
While the advantages and disadvantages noted above are not exhaustive lists. However, they provide a rationale for how sound business strategies provide a clear roadmap, empowering your business to transform raw information into actionable goals that propel growth and resilience.
For example, companies using predictive analytics have reported up to a 20% increase in operational efficiency by proactively addressing potential risks. Additionally, real-time data analysis has allowed businesses to respond to market changes more effectively, giving them a competitive edge.
The transition from reactive decision-making to proactive planning is particularly important in today’s fast-paced digital landscape. Organizations that fail to leverage data risk being left behind as competitors capitalize on insights to optimize operations, enhance customer experiences, and drive innovation.

Step-by-Step Guide to Setting Data-Driven Goals
Establishing effective goals involves a structured approach. Follow these steps to ensure your objectives are meaningful, measurable, and impactful.
· Step 1: Analyzing Historical Data
The foundation of a successful strategy lies in understanding past performance. As a robust needs assessment, your historical data reveals patterns, strengths, and areas for improvement. Begin by:
o Reviewing Performance Metrics: Analyze sales figures, customer retention rates, and operational KPIs.
o Segmenting Data: Break down information by demographics, regions, or product lines to uncover specific insights.
o Highlighting Trends: Identify consistent patterns or anomalies that may inform future decisions.
o Conducting Gap Analysis: Compare current performance to benchmarks or industry standards to identify gaps.
o Uncovering Correlations: Analyze relationships between different data sets to better understand cause and effect relationships.
o Assessing External Factors: Review external data, such as market conditions or competitor performance, to provide context for your internal metrics.
Example: A retail business may find that online sales consistently outperform in the first quarter. This insight can guide promotional strategies for the upcoming year. Additionally, manufacturing companies analyzing production downtime trends might discover that preventive maintenance could significantly reduce costly disruptions.
Beyond identifying trends, historical data can provide valuable lessons about what hasn’t worked. For example, marketing campaigns with low ROI can reveal misaligned messaging or targeting, enabling teams to make more informed adjustments.
· Step 2: Identifying Key Performance Indicators (KPIs)
KPIs translate broad goals into measurable targets. These metrics should align with your organization’s objectives and reflect critical success factors. To identify the right KPIs:
- Link to Objectives: Ensure KPIs directly support overarching business goals.
- Focus on Actionable Metrics: Choose data points that drive actionable insights rather than vanity metrics.
- Set Benchmarks: Use industry standards or past performance as a reference.
- Take a Multi-faceted Approach: Select a cluster of KPIs that will ensure you have a robust view of performance and isn’t skewed by minimal information.
o Prioritize Leading Indicators: Focus on KPIs that predict future performance, such as customer inquiries, instead of lagging indicators like quarterly revenue.
o Assess Resource Availability: Choose KPIs that can be effectively monitored and managed with your existing tools and personnel.
o Incorporate Cross-Functional Metrics: Identify KPIs that span multiple departments, fostering collaboration and unified strategies.
Example: If your goal is to improve customer satisfaction, relevant KPIs could include Net Promoter Score (NPS) or average resolution time for support tickets. For a SaaS company, monthly recurring revenue (MRR) and customer churn rate may be vital metrics to track.
Expanding KPIs beyond traditional metrics can also yield significant benefits. For instance, tracking engagement with digital touchpoints, such as app usage or website interactions, provides a deeper understanding of customer behavior.
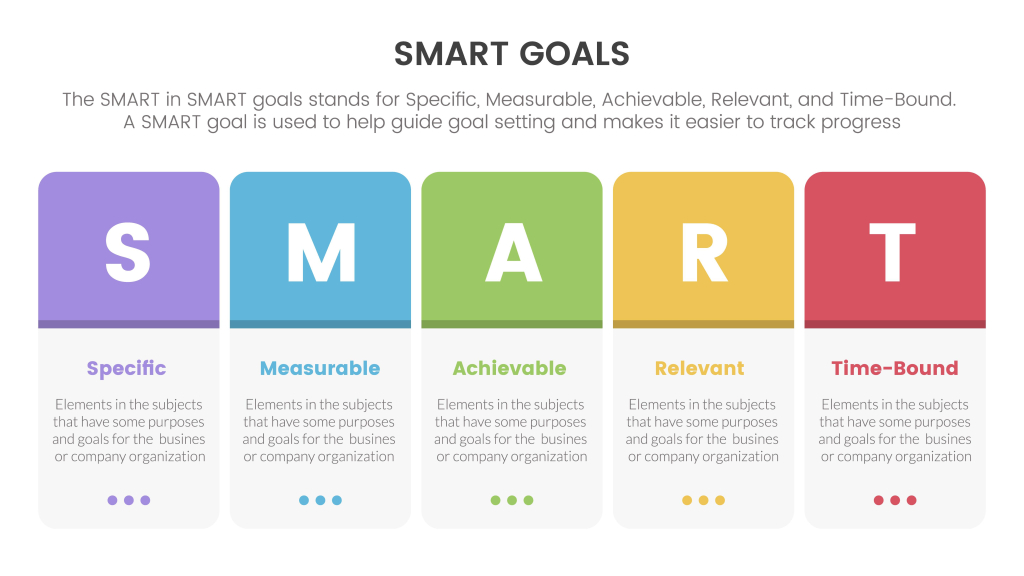
· Step 3: Setting SMART Goals
SMART goals (Specific, Measurable, Achievable, Relevant, Time-bound) are essential for clarity and accountability. Here’s how to craft them:
- Specific: Use precision when identifying what your goals are. Measurable: Include quantifiable metrics to track progress.
- Achievable: Ensure goals are realistic, given your resources and constraints.
- Relevant: Align with broader business objectives.
- Time-bound: Establish a clear deadline.
Example: Increase website traffic by 20% over six months by optimizing SEO and launching targeted ad campaigns. For an e-commerce platform, a SMART goal might be to achieve a 15% increase in average order value within the next quarter by introducing upselling techniques.
Setting SMART goals also encourages cross-departmental collaboration. For example, aligning sales and marketing teams on shared targets, such as lead generation and conversion rates, ensures a more unified approach to achieving objectives.
· Step 4: Using Data Visualization for Clarity
Visualization makes complex data more accessible and actionable. Tools like dashboards and charts can:
o Highlight Trends: Show patterns at a glance.
o Facilitate Communication: Help stakeholders quickly grasp key insights.
o Support Decision-Making: Enable data-driven discussions and strategies. Track Real-Time Changes: Dynamic visualizations, such as real-time dashboards, allow users to monitor ongoing performance and adjust strategies immediately.
o Reveal Hidden Opportunities: Sophisticated visualizations can uncover relationships or patterns not evident in raw data, providing actionable insights for growth.
o Engage Stakeholders: Intuitive visual representations foster better engagement, ensuring all stakeholders understand and support the decision-making process.
Example: A sales team uses a dashboard to track monthly revenue by region, identifying top-performing territories and areas needing attention. Similarly, healthcare organizations often use visualizations to monitor patient care outcomes, ensuring better quality control and resource management.
Investing in dynamic visualization tools, such as real-time dashboards, adds another layer of utility. These tools allow businesses to monitor KPIs as they evolve, helping teams pivot quickly when performance deviates from expectations.
· Step 5: Regularly Monitoring Progress and Adjusting
Goals aren’t static; they evolve as circumstances change. Regular monitoring ensures you stay on track and adapt to new developments. Implement these practices:
o Schedule Reviews: Conduct monthly or quarterly check-ins.
o Use Alerts: Set up notifications for significant deviations from expected performance.
o Refine Strategies: Adjust goals or tactics based on new insights.
o Monitor External Influences: Track market trends, competitor movements, and regulatory changes to understand external factors that might impact your goals.
o Evaluate Resource Allocation: Continuously assess whether resources are effectively distributed across projects to ensure alignment with priorities.
o Track Team Performance: Regularly review team contributions to ensure roles and responsibilities are aligned with overall objectives.
Example: A tech startup may revise its customer acquisition strategy after realizing that a specific campaign underperforms. By analyzing customer feedback and performance metrics, they could pivot to a more effective channel.
Reviewing frequently and on a regular schedule helps your team be more agile and allows you to respond promptly to changing trends. Businesses that iterate on their strategies based on real-time feedback are better positioned to seize emerging opportunities.
Bonus: Top Tools and Technologies for Data-Driven Planning in 2025
Harnessing the right tools can make or break your data strategy. Here are some of the top technologies to consider:
· Data Analytics Platforms: Tools like Tableau and Power BI enable in-depth data analysis and visualization.
· Customer Relationship Management (CRM) Systems: Platforms like Salesforce centralize customer data, improving decision-making.

· Predictive Analytics: Tools such as SAS or IBM Watson provide foresight by analyzing trends and forecasting outcomes.
· Automation Software: Solutions like Zapier streamline data collection and integration across systems.
· Project Management Tools: Applications like Asana or Monday.com help track progress toward data-driven goals.
· Cloud-Based Solutions: Platforms like Snowflake and AWS allow for scalable data storage and advanced analytics, ensuring businesses can handle growing data volumes.
· Business Intelligence Tools: Applications like Looker or Qlik offer comprehensive data modeling, enabling deeper exploration and actionable insights.
· Data Integration Platforms: Tools like Apache Kafka or Talend help unify data from multiple sources, ensuring a seamless flow of information.
· Data Governance Tools: Solutions like Collibra or Alation assist businesses in maintaining data accuracy, security, and compliance.
· AI-Powered Insights Tools: Platforms like Google Cloud AI or Microsoft Azure AI provide advanced machine learning capabilities to derive predictive and prescriptive insights.
By integrating these technologies, businesses can streamline operations and amplify results, fully leveraging data for growth. For instance, companies that adopt AI-driven analytics often see faster decision-making and a significant reduction in human error. The synergy of tools like CRM systems and predictive analytics also enables more precise customer segmentation and personalized outreach.
Final Thoughts
As 2025 approaches, the importance of setting goals grounded in data cannot be overstated. By analyzing historical data, identifying meaningful KPIs, and adopting SMART goals, businesses can pave the way for sustainable growth. Combine these efforts with the power of data visualization and modern tools, and you’ll be well-positioned to thrive in the dynamic landscape of the new year.
Organizations that embrace business data strategies today will find themselves better prepared to tackle tomorrow’s challenges. Whether it’s improving operational efficiency, enhancing customer satisfaction, or identifying new revenue streams, data-driven decision-making is the key to unlocking potential.
Contact Klik Data Services for tailored data strategy solutions to achieve your 2025 goals! At Klik, we believe your data can take you places. What’s your destination?
____________________________________________________________________
Frequently Asked Questions (FAQs)

Top tools include Tableau, Power BI, Salesforce, and Monday.com. These platforms provide comprehensive solutions for analysis, visualization, and project management.
Small businesses can start by analyzing affordable data sources like website analytics or social media metrics. Tools like Google Analytics and HubSpot are cost-effective options for actionable insights. Additionally, leveraging customer feedback surveys and free data visualization tools can help small businesses craft effective strategies.